Choosing a quality metric
Helia ranks every frame of a capture by a sharpness metric and stacks the best ones. The default, gradient energy, is the right choice for every capture measured so far. This page shows how to compare the metrics on your own capture, step by step, and what the comparison looked like on real captures.
You need a capture, helia on your path, and a few minutes. Nothing here needs
a GPU.
The metrics
--metric |
What it measures | Runs on |
|---|---|---|
gradient (default) |
Mean squared difference between neighbouring pixels of the lightly blurred frame, less the noise floor, divided by the squared mean brightness. | GPU and CPU |
laplacian |
Variance of the second derivative of the same blurred frame. | GPU and CPU |
helmli |
Helmli and Scherer's mean: how far, as a ratio, each pixel sits from the mean of its 5x5 neighbourhood. After Popowicz et al. (2017). | CPU |
mfgs |
Median-filter gradient similarity: the Scharr gradient of the frame compared with that of its 3x3 median-filtered copy, as one minus the similarity. After Deng et al. (2015) and Popowicz et al. (2017). | CPU |
dct |
DCT energy ratio: the share of the 8x8 block DCT energy in the high coefficients (u + v of 4 or more). After Popowicz et al. (2017). |
CPU |
fourier |
Power between 1/16 and 1/4 cycle per pixel in 128 px tiles of the disc, less the noise measured between 0.4 and 0.5 cycle per pixel, over the zero-frequency power. | CPU |
contrast |
Mean local RMS contrast (standard deviation over mean in a 5x5 window) over the lit part of the frame. | CPU |
Every metric ignores overall brightness: a frame that is only brighter does not
rank higher. The CPU-only metrics are scored on the CPU even when you ask for
the GPU, so the stack as a whole still uses the GPU. They are slower: on a
630-frame 1920x1080 capture on a 24-core CPU the scoring stage took about
1x the gradient time for dct and laplacian, 1.2x for helmli, 1.5x for
fourier, 3x for contrast and 5x for mfgs (measured on a busy machine, so
read these as rough ratios).
The metrics are our implementations of published ideas. The definitions are on
the functions in helia_core::quality_extra; where the papers leave room (the
window sizes, the DCT split, the Fourier bands) the choice is ours.
Step 1. Stack once per metric
Use one capture and change nothing but --metric. Write FITS, so the file is
the unsharpened stack and sharpening does not enter the comparison. This is
15_37_19.avi, an H-alpha capture with the red plane clipped (so Helia stacks
the green plane, as it says):
for m in gradient laplacian helmli mfgs dct fourier contrast; do
  helia stack --preset ha --metric $m -o 15_37_19-$m.fits 15_37_19.avi 2> 15_37_19-$m.log
done
Each run prints the same summary as usual. Check the frames: line is the same
for every metric (here 1000 total, 250 kept): the only difference should be
which frames those are.
Step 2. Measure the result
The measure that matters is the contrast of the stack in the band that holds
the detail you want. helia measure gives three bands, as the standard
deviation of a band-pass over the mean:
- 0 to 1 px: pixel noise.
- 1 to 4 px: granulation, the fine structure of white light.
- 4 to 12 px: the mesogranular scale; in H-alpha and Ca K, filaments, fibrils and the network.
Each stack must be measured over the same part of the Sun. By default measure
centres its crop on the centroid of the bright pixels, which moves with
prominences. Take the fitted disc centre from the stack's disc: line and give
it with --centre:
grep '^disc:' 15_37_19-gradient.log   # the fitted disc
# disc:    centre (271.5, 294.5), radius 222.1 px
helia measure 15_37_19-gradient.fits --crop 200 --centre 272,294
Repeat for each metric with that stack's own disc centre. The script
tools/metric_bakeoff.py in the source tree does steps 1 and 2 together:
python tools/metric_bakeoff.py helia 15_37_19.avi ha out/ prints the table
below for one capture. Compare only like with like: the same crop size, and stacks of
the same capture.
Step 3. Read the table
Divide each band by the gradient result. On the real captures at hand (stack of the best 25 to 30 per cent, 200 px crop, per cent of the gradient value; above 100 means more contrast than gradient energy):
| Capture | Filter | Band | laplacian | helmli | mfgs | dct | fourier | contrast |
|---|---|---|---|---|---|---|---|---|
| owner 15_32_09 | H-alpha | 4-12 px | 101 | 104 | 101 | 101 | 100 | 100 |
| owner 15_37_19 | H-alpha | 4-12 px | 98 | 97 | 99 | 98 | 101 | 99 |
| 2022 15_20_57 | H-alpha | 4-12 px | 100 | 99 | 97 | 97 | 99 | 100 |
| 2022 Sun_Test | H-alpha | 4-12 px | 101 | 100 | 100 | 97 | 99 | 100 |
| owner 15_36_42 | Ca K | 4-12 px | 98 | 106 | 96 | 94 | 99 | 94 |
| owner 15_44_48 | Ca K (mono) | 4-12 px | 100 | 100 | 101 | 92 | 100 | 98 |
| 2022 14_42_57 | broad band | 1-4 px | 99 | 127 | 135 | 98 | 97 | 93 |
| 2022 14_42_57 | broad band | 4-12 px | 89 | 148 | 163 | 88 | 81 | 73 |
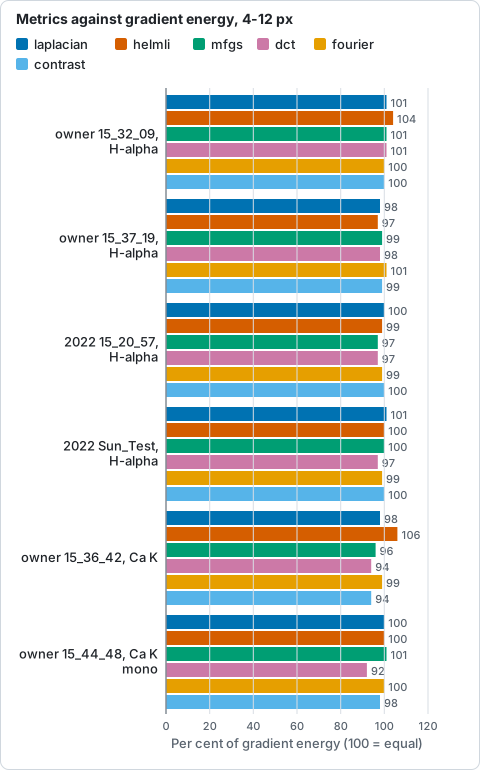
Contrast in the 4 to 12 px band of stacks ranked by each metric, per cent of the gradient-energy stack, from the table above.
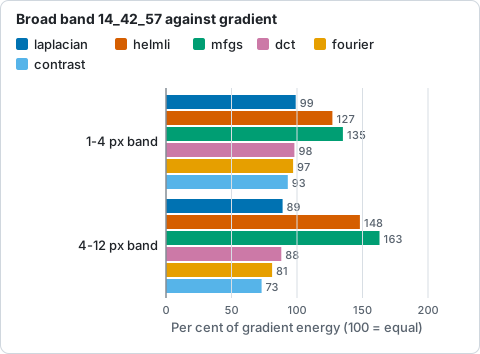
Contrast of the 2022 broad-band capture 14_42_57 stacked by each metric, per cent of the gradient-energy stack, from the table above.
What the table says:
- H-alpha and Ca K: nothing beats gradient energy. Every metric is within about 6 per cent of it in the 4 to 12 px band, some above and some below, with no consistent winner. That is the size of the change from keeping a few different frames, not a better metric. The default stays, and it is the only one of these that runs on the GPU.
- Broad band (
14_42_57.avi, label unknown, red half clipped, 76 frames kept): Helmli and MFGS stack to more contrast, 27 and 35 per cent more in the granulation band and 48 and 63 per cent more in the 4 to 12 px band. The pixel-noise band was the same for every metric (0.09 to 0.11 per cent), so the gain is not noise. This is one capture, so it is a lead and not a result. There is no other white-light stack from a raw camera in the test set (the Seestar MP4 needs ffmpeg and is lossy), so Helia does not change the white preset. If your white-light stacks are soft, try--metric helmliand measure as above.
How different are the rankings? On the first 120 frames of the H-alpha capture
15_32_09.avi, the share of gradient energy's best quarter that each metric
also puts in its best quarter is 60 per cent for laplacian, 70 for helmli,
47 for fourier, 33 for mfgs and dct and 23 for contrast (chance is 25).
The metrics do rank differently, and on stacks of the best quarter the
differences largely average out; the real-data test
every_ranking_metric_agrees_with_gradient_energy_on_real_frames keeps this
from silently breaking.
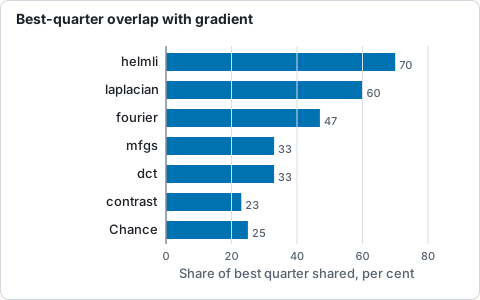
Share of gradient energy's best quarter that each metric also puts in its best quarter, first 120 frames of 15_32_09 (H-alpha), from the text above.
Does the seeing decide it?
The idea was to pick the metric from the seeing estimate: Popowicz
et al. find Helmli and MFGS strongest in good seeing and the DCT ratio in poor.
helia stack --seeing gives a motion index and, when the scale is right, an
r0. On the captures here:
| Capture | Motion index (px) | D/r0 |
|---|---|---|
| 15_20_57 | 0.19 | 4.0 |
| Sun_Test | 0.27 | 7.3 |
| 14_42_57 | 0.50 | 7.8 |
| 15_36_42 | 0.27 | 13 |
| owner 15_32_09, 15_37_19 | 0.16, 0.17 | 14, 11 |
| 15_44_48 | 0.93 | not fitted |
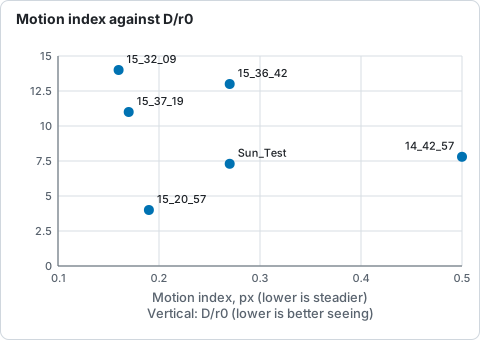
Motion index and D/r0 of the captures at hand (pixel scale assumed), from the table above; 15_44_48 has no fitted D/r0.
(The pixel scale of these captures is assumed and the tiles are wider than an
isoplanatic patch, so the D/r0 figures are indicative.) The capture where the
metrics differ, 14_42_57, sits in the middle of the range on both measures,
and the captures at the extremes show no difference between metrics. Nothing
here supports switching the metric on the seeing, so Helia does not.
Troubleshooting
- The frame counts differ between runs. They should not. Check you passed
the same
--keepand preset to every run. - The numbers move by a few per cent between runs of the same metric. They
should not; if you changed
--cropor the centre they will. Use the same crop and centre rule for every stack. --metric mfgsorcontrastis slow. They score on the CPU and take three to five times as long as gradient energy for the scoring stage. Use gradient for quick looks.- A flat region of sky gives odd scores. Metrics other than gradient and
Laplacian lift or ignore the sky in their own ways; keep
--excludeon any burned-in text, as for every capture.
Where the metric is set
| Where | Setting | Values | Default |
|---|---|---|---|
| Command line | --metric |
gradient, laplacian, helmli, mfgs, dct, fourier, contrast |
gradient |
API job config |
metric |
the same words | "gradient" |
| Desktop app | Analyse step, Sharpness metric | Gradient energy, Laplacian variance | Gradient energy |
The desktop app offers the two metrics that have a GPU kernel; the others are for the command line and the API.
References
- Popowicz, Radlak, Bernacki, Orlov (2017), Review of image quality measures for solar imaging, arXiv:1709.09458.
- Deng, Zhang, Wang, Ji, Wang, Liu, Xiang, Jin, Cao (2015), Objective image quality assessment by median-filter gradient similarity, arXiv:1701.05300.
- Kamlah, Verma, Diercke, Denker (2021), Wavelength dependence of image quality metrics and seeing parameters, arXiv:2011.04346.