How the astrometry and photometry outputs work
These outputs show how good a plate solution is and what the stars say about the picture and
the night: the annotated image (an RA/Dec grid, catalogue objects and Gaia stars drawn on the
picture), the residual vectors of the solution and their map across the frame, the
colour-calibration scatter of valerian photocal, the zero point and colour term of each
colour plane, a calibrated star catalogue with magnitudes and errors, the limiting
magnitude, and the light curve of one star across frames. valerian annotate,
valerian photocal --report, valerian photometry and valerian plot make them; the desktop
app has them in the Astrometry tool of the Process step and in the Science panel of the
Stack step. For a worked example start with tutorial 15, and
tutorial 20 for the magnitudes; this page says what each
output is, how it is made and what every option and control does.
The annotated image
valerian annotate IMAGE --report DIR needs a plate solution: the image's own (written by
valerian solve), the one in --wcs FILE's header, or, when the image has none, one found
by a quick solve from the header's position and scale (it says so). The picture is the image
stretched by the automatic midtone stretch (sky at 25 per cent), reduced by block means to
--max-side pixels, with:
- A grid. The spacing of the declination lines is the smallest of 0.25, 0.5, 1, 2, 5, 10, 15,
20, 30 arc minutes and 1, 2, 5, 10, 15, 20 or 30 degrees that gives at most six lines across the
field; the right-ascension lines the smallest of 1, 2, 5, 10, 15, 30 seconds of time, 1, 2, 5, 10,
15, 30 minutes and 1, 2, 4, 6, 12 hours likewise. Each line is followed through the solution
(so it curves with SIP distortion and near the poles) and labelled where it enters the picture:
declinations at the left, right ascensions at the bottom. The title line gives the centre in
hh:mm:ss.s +dd:mm:ss, the scale, the rotation and whether the image is mirrored. - Catalogue objects. The bundled list holds every Messier object and the NGC and IC
galaxies, clusters, planetary and other nebulae and supernova remnants that are bright (V 11.5
or brighter, or B 12.5) or large (8 arc minutes or more): 1613 objects, and a CSV of them
is the file
crates/valerian-science/data/objects.csv. An object with a catalogued size is drawn as an ellipse of that major and minor axis at its position angle (carried through the solution, so it turns with the image), with semi-axes of at least 5 and 4 pixels; one without as a small circle. The colour says the kind (galaxies orange, clusters yellow, planetary nebulae aquamarine, supernova remnants pink, other nebulae green). The 40 largest are labelled with their name and common name. - Gaia stars. The catalogue stars brighter than
--star-mag(G 10 by default) in the field, as circles that grow with brightness, labelled with their G magnitude when brighter than--label-mag(8).
--no-grid, --no-objects and --no-stars leave a layer out. Without the star catalogue
there are no Gaia stars and no residuals, and it says so.
The bundled object list is a subset of OpenNGC by Mattia Verga
(https://github.com/mattiaverga/OpenNGC), made by scripts/build_objects.py. OpenNGC is
licensed CC BY-SA 4.0; the subset keeps that licence (the file is annotated in REUSE.toml
and the licence text is in LICENSES/CC-BY-SA-4.0.txt), which is compatible with the GPL for a
program that carries the data. If you redistribute Valerian, the data file and its licence travel
with it.
The residuals of the solution
The stars of the image are detected (as for valerian solve) and each is matched to the nearest
unclaimed Gaia star within 3 pixels of where the solution puts it, brightest detections first.
The residual of a star is the detected position minus the projected catalogue position
(dx, dy, pixels; times the scale, arc seconds). At least 10 stars must match. The sheet shows
- the vector field: an arrow from every matched star along its residual, exaggerated so that
the 90th percentile arrow is about a twentieth of the short side of the frame (the factor is in
the title, a bar shows half a pixel at that factor), coloured by length. A solution that is as
good as the data shows short arrows pointing every way. A pattern is a fault: arrows all alike
are a shift (the centre of the solution is off), arrows that turn round a point are a rotation, arrows
that point to or from the middle are a scale error, and arrows that curve towards the corners are
distortion the TAN model without SIP cannot fit (solve with SIP,
valerian solve --sip-order); - the residual length against magnitude, with the rms as a line: the faint stars are noisier, and a bright star far above the rest is a double star or a bad match.
wcs_residuals.csv lists every star (x, y, ra_deg, dec_deg, g, dx_px, dy_px,
length_px, length_arcsec), and astrometry.json has the rms, the median, the mean shift and
the list.
The colour-calibration scatter
valerian photocal --report DIR (and valerian plot pcc) draw what the colour fit rests on: for
every Gaia star measured, its instrumental colour -2.5 log10 (F_red / F_green) (and the same
for blue) against its Gaia BP-RP, with the fitted line
instrumental colour = zero + slope x (BP-RP - reference), the stars the fit used as blue dots
and the ones it rejected as red crosses, and a vertical line at the BP-RP that is made neutral
(0.82 by default). The title of each panel has the slope, the scatter about the line and the gain
the fit gives; the gain is 10^(0.4 x zero). A healthy fit is a tight line through the cloud, red
sloping down (redder stars are relatively brighter in red) and blue up. pcc.csv has every star's
position, G, BP-RP, both colours, both residuals and whether it was used; pcc.json the lines, the
gains with their uncertainties, the offsets and the warnings. The options of the fit are those of
valerian photocal (see How colour calibration works).
The astrometric residual map
The residual vectors of a few hundred stars are hard to read as a picture; the map bins them.
valerian annotate --report DIR writes it as residual_map.png, .csv and .json (and
valerian plot residual-map IMAGE -o FILE.png makes it on its own). The frame is cut into
--map-grid cells a side (6 by default, 2 to 24; pick it so that a cell holds five stars or more,
which is floor(sqrt(stars / 5)) for stars spread evenly: 3 for the 72 stars of tutorial 20, 6 for
about 180). A cell with at least 3 matched stars is drawn
as an arrow along the mean residual of its stars, coloured by length, with the number of
stars in its corner; a thinner cell is left grey. Averaging cancels the star-to-star scatter, so
a fault of a tenth of a pixel that the single vectors hide shows as a smooth pattern.
The map also fits the linear part of the pattern. With u and v the offsets in pixels from the
frame centre, dx = a0 + a1 u + a2 v and dy = b0 + b1 u + b2 v are fitted to every star's
residual by least squares, and read as
- scale,
(a1 + b2) / 2, in parts per million. Positive means the stars lie farther from the centre than the solution says, so the solution's scale is a little small. A scale error of 500 ppm moves a star 1118 pixels from the centre (the corner of a 2000 by 1000 frame) by 0.56 pixels; - rotation,
(b1 - a2) / 2times the half-diagonal times the pixel scale, in arc seconds at the corner of the frame. Positive is stars turned from the +x axis towards +y (clockwise on the screen, because y runs down); - anisotropy,
(a1 - b2) / 2, and shear,(a2 + b1) / 2, in ppm: unequal scales along x and y, and a skew between the axes. Both should be near zero for a camera with square pixels; - rms before and after: the residual rms with and without the linear terms. If the second is
far below the first, the solution has a simple fault that a better fit would remove. If they are
close, what is left is not linear: distortion the TAN projection cannot hold (solve with SIP,
valerian solve --sip-order), or noise.
The right side of the sheet plots every star's radial residual (along the line from the
centre) and tangential residual (across it) against its distance from the centre, with the
linear fit as a line. Optical distortion is radial and grows as a power of the radius, so a
curve in the radial plot that the straight line misses is the distortion. A rotation is purely
tangential and a scale error purely radial, which is why the two plots are kept apart.
residual_map.csv has a line per cell (ix, iy, the centre x, y, stars, mean_dx_px,
mean_dy_px, mean_length_px, mean_length_arcsec, scatter_px); residual_map.json the cells,
the linear terms and the mean radial and tangential residual in five rings from the centre
(empty cells and rings are null). The linear fit needs stars spread over the frame: if they lie on a
line it says so and writes no map.
The zero point and colour term
valerian photocal IMAGE --report DIR (and valerian plot zeropoint IMAGE -o FILE.png) turn the
Gaia stars of the colour fit into the photometric zero point of each colour plane. A star of Gaia
magnitude G that gives a flux F (the sum over the aperture less the sky, in the pixel units
of the image) has zp = G + 2.5 log10 F in that plane. The zero point turns a flux into a
magnitude, m = zp - 2.5 log10 F. The stars do not all give the same zp, because the camera's
red, green and blue do not match Gaia's G band: a redder star is relatively brighter in the red plane.
The difference is a straight line in the Gaia colour BP-RP, the colour equation of photometry
(Stetson 2000):
zp = Z + k (BP-RP - 0.82)
Z is the zero point of a star of the reference colour (0.82, the Sun, --reference-colour),
k the colour term in magnitudes per magnitude of BP-RP. The fit is least squares on the stars the
colour fit kept, with 3-sigma clipping (at least 8 stars must remain). The sheet has three panels:
- the zero point against G with the colour term removed for each plane, with the fitted
Zas a horizontal line. It is flat for a linear camera. A tilt means the bright stars are saturated or the response is not linear (a warning says so when the drift across the measured range exceeds 0.1 mag), and the trend istrend_with_gin the JSON; - the zero point against BP-RP for each plane, with the colour-term lines: this is the picture of the colour response of your camera and filter. Red slopes up and blue down, by an amount that depends on the filter and sensor (the Seestar S50 stack of tutorial 20 gives red +0.02, green -0.28 and blue -0.74 mag per BP-RP);
- the residual of the green plane across the field, against the distance from the centre, with the median in five rings. A flat line is a flat field and no vignetting; a fall at the corners is vignetting the flats did not remove, and a magnitude measured there is that much too faint.
The title and legend give Z with its standard error (the error of the intercept of the
fit), k with its error, and the scatter of the stars about the line (the rms of the residuals).
The scatter is the real precision of one star's magnitude; the error of Z is how well the whole
scale is known. zeropoint.json has, per plane, zero, zero_error, colour_term,
colour_term_error, scatter, stars (kept), trend_with_g and zero_after_gain, the zero point of
the image after the gains of the colour calibration are applied (Z + 2.5 log10 gain: red and blue
land on the green value by construction); zeropoint.csv has every Gaia star measured (x, y,
g, bp_rp, zp_r, zp_g, zp_b, the three residuals and kept_rgb, three digits for the planes
that kept it). The zero point is for the pixel values the image had when it was measured, which
is the image given to photocal before the gains; magnitudes from the catalogue below are the same
before and after the gains.
The calibrated star catalogue
valerian photocal IMAGE --calibrated-stars FILE.csv (and --report DIR, which writes
calibrated_stars.csv) lists every star detected in the image, not only Gaia's, with a
magnitude in each plane. Stars are found as for the colour fit but down to --field-threshold
sigma (5 by default; the brightest --max-field-stars, 5000, are kept) and measured in the same
aperture and sky annulus as the Gaia stars. For each star:
- Colour. A star with a Gaia match (within half a pixel of a star the fit used) takes its Gaia
BP-RP, flag
G. Any other star has its BP-RP estimated from its own colours by inverting the two lines of the colour fit (instrumental colour = zero + slope (BP-RP - 0.82)), red against green and blue against green, each weighted by the inverse of its variance; it needs a signal-to-noise ratio of 10 in all three planes and a positive flux in each. A star too faint for that is given the reference colour 0.82 with an error of 0.4 and flagE, which is about the spread of star colours. - Magnitude.
m = Z + k (BP-RP - 0.82) - 2.5 log10 Fin each plane: a Gaia-G equivalent magnitude, which is what Gaia's G of that star would be if the star's colour were as estimated. For a star of the reference colour all three planes agree; the difference between planes is the measure of how wrong the colour is. - Error. The three parts add in quadrature: the photon and sky noise of the aperture,
1.0857 / SNR(the first-order error of-2.5 log10 F, Howell 1989), the standard error ofZ, and|k|times the error of the colour. The scatter of the stars about the colour line is not in the error: it is what the calibration stars show of the true error at the bright end, and it is inzeropoint.json.
calibrated_stars.csv columns: id (1 is the brightest in green), x, y, ra_deg, dec_deg,
mag_g, mag_g_err, mag_r, mag_r_err, mag_b, mag_b_err, snr_g, flux_g, bp_rp,
bp_rp_err, gaia_g and mag_g_minus_gaia_g (for Gaia stars: a direct check of the calibration),
fwhm_px and flags: S saturated (the magnitude is too faint), C crowded (another star in the
aperture or annulus), E colour assumed, N a plane has no positive flux (its magnitude is
empty), B brighter than every Gaia star the zero point was fitted on (unverified, and probably
partly saturated: the three brightest Gaia stars of tutorial 20 come out 0.2 to 0.4 mag too faint),
G matched to Gaia. Leave out S, C, N and B rows when you use the table.
The catalogue contains only measurements from your image and the Gaia values already in the catalogue file you supply; Valerian adds no star data of its own to it.
The limiting magnitude
The same run reports how faint the image goes, at --limit-snr (5 by default), as a point-source
limit: the magnitude of a star whose aperture flux is that many times the noise of one aperture
(Newberry 1991),
m_lim = Z - 2.5 log10 (S sigma_ap)
where sigma_ap is the median sky-noise error of the apertures of the catalogue stars that are
neither saturated nor crowded, flux / SNR for each (the error from the sky scatter and its
estimate alone, so the star's own photon noise is left out: the limit is for a faint star). It is
given for each plane, and in zeropoint.json for green at 3 and 10 sigma too. Two checks on it
come from the stars:
- the faintest star measured at that signal-to-noise in green. It lies within a few tenths of a magnitude of the limit on either side: the signal-to-noise of one faint star scatters, so the faintest of thousands sits a little past the line;
- the peak of the differential counts, the centre of the half-magnitude bin of the green magnitudes that has the most stars. Star counts rise with magnitude until the detection runs out; the peak is the usual measure of where the catalogue stops being complete. It is shown only with at least 30 stars. For a stack that is cleanly background-limited it lies near the 5-sigma limit (0.2 mag from it in tutorial 20); a crowded or nebulous field peaks earlier, because the stars blend before they sink into the noise.
The limiting_magnitude.png sheet plots log10 SNR against magnitude for the unsaturated, uncrowded
stars (Gaia stars in orange), with the horizontal line at the signal-to-noise ratio and the vertical
line at the limit, and the star counts per half magnitude with the limit and the peak. Points fall on a
line of slope -0.4 (one dex in SNR per 2.5 mag) until the star's photon noise matters. The Gaia
catalogue stops at G 11, so the limit is extrapolated from the apertures, not read from Gaia
stars of that faintness; the faint end of the catalogue has not been checked against a deeper catalogue.
Aperture photometry across frames
valerian photometry FRAMES --report DIR measures one star in every frame:
- The frames are registered to the sharpest (or
--reference), as for the stack. - The star's position in the reference frame is
--star X,Y, or the brightest star that is not saturated and not near an edge. (A star is saturated when a colour plane reaches the top of the 16-bit range, 60000 ADU or more, or of a 0 to 1 scale, and a pixel within 2 pixels of the star is within 15 per cent of that top.) The position is carried to every frame through the registration and refined there by a flux-weighted centroid (up to 4 iterations, rejected if it moves more than the aperture radius). - The aperture is a circle of
--aperturetimes the FWHM of that frame (2.0 by default, at least 2 pixels), so a soft frame loses no more of the star than a sharp one. Pixels cut by the edge count by the fraction of their area inside (6 by 6 subpixels). The sky is the sigma-clipped median of the annulus from 1.5 to 2.2 times the radius (at least 4 pixels wide); the flux is the sum of the aperture less the sky times its pixels. The error is the sky scatter timessqrt(n (1 + n / n_sky))for thenpixels of the aperture: it is the error from the background alone, a floor, not the whole error. - Up to
--comparisonstars (10 by default) are chosen in the reference frame the same way: not saturated, with no brighter neighbour within the annulus, away from the edges and the target, and measured in every frame (otherwise in nine tenths of them). Their summed flux is the ensemble. The star's relative magnitude is-2.5 log10 (F_star / F_ensemble)less its median over the frames, so clouds, airmass and exposure changes that dim every star alike drop out, and a change in the star alone stays. Brighter is more negative, and the plot has brighter up. - The check star, the first comparison star measured against all the others, has the same treatment. It should be flat: its scatter is the real precision of the night, which the formal errors do not include (scintillation, seeing, field rotation, the demosaicing of a colour camera).
Mid-exposure time is DATE-OBS plus half EXPTIME; a frame without it is plotted by number.
lightcurve.csv has per frame: frame, name, time_utc, hours, x, y, aperture_px,
flux_adu, flux_error_adu, sky_adu, snr, ensemble_flux_adu, mag_instrumental,
mag_relative, mag_error, check_mag, ok and note; a frame in which a comparison star could
not be measured is ok 0 and says so. lightcurve.json has the same with the apertures,
the comparison positions and the two scatters.
| Option | What it does | Range | Default |
|---|---|---|---|
valerian annotate IMAGE |
the image to draw on | a solved FITS file | required |
--report <DIR> |
folder for the picture, lists, residuals and report.html | a folder | astrometry-report |
--wcs <FILE> |
take the plate solution from this file's header | a FITS file | the image's own, else a quick solve |
--catalogue <FILE> |
the star catalogue | a .vcat file |
the one beside the program |
--no-grid, --no-objects, --no-stars |
leave a layer out | all drawn | |
--star-mag <MAG> |
faintest Gaia star drawn | G 4 to 11 | 10 |
--label-mag <MAG> |
Gaia stars brighter than this are labelled | 8 | |
--max-side <PIXELS> |
longest side of the picture | 200 to 6000 | 1400 |
valerian photocal --report <DIR> |
write the colour-fit scatter, the zero points, the limiting magnitude and the calibrated catalogue | a folder | not written |
--calibrated-stars <FILE> |
write the calibrated star catalogue as CSV (photocal) |
a file | not written |
--limit-snr <SNR> |
the signal-to-noise ratio that defines the limiting magnitude (photocal, plot) |
above 0 | 5 |
--field-threshold <SIGMA> |
detection threshold of the catalogue stars (photocal) |
above 0 | 5 |
--max-field-stars <N> |
the most stars in the catalogue, the brightest (photocal) |
1 or more | 5000 |
--map-grid <N> |
cells a side of the residual map (annotate) |
2 to 24 | 6 |
valerian photometry FRAMES |
frames to measure | FITS files or folders | required |
--report <DIR> |
folder for the light curve | a folder | photometry-report |
--star <X,Y> |
the star, pixels in the reference frame | the brightest unsaturated star | |
--aperture <FWHM> |
aperture radius in FWHM | 1 to 5 | 2.0 |
--comparison <N> |
comparison stars at most | 3 or more | 10 |
--reference, --model, --debayer, --threshold |
as for register | the sharpest frame, similarity, auto, 5 |
valerian plot annotate|residuals|residual-map|pcc|zeropoint|limiting-mag IMAGE -o FILE.png and
valerian plot lightcurve FRAMES -o FILE.png --star X,Y draw one on its own, with --wcs,
--catalogue, --star-mag, --aperture, --comparison, --limit-snr (zeropoint, limiting-mag) and
--grid (residual-map, 2 to 24, default 6), and write the data beside the PNG (.csv and
.json; for limiting-mag the CSV is the calibrated catalogue). valerian plot zeropoint and
limiting-mag run the colour fit with its default settings first; use valerian photocal when you
need other settings (--min-snr, --max-mag and the rest).
The Astrometry tool and the light curve in the desktop app
Astrometry (Process step): open a plate-solved image (or run the Plate solve tool first; its
result is used even if you have not saved it), choose the layers and press Draw the solution.
It runs on a worker thread, and the chips under Picture show Annotated, Residuals,
Residual map and, for a linear colour image, Colour fit, Zero point and Limiting
mag. Save report writes the same folder as the command line, with the residual map, the zero
points and the calibrated catalogue (calibrated_stars.csv).
| Control | Range | Default |
|---|---|---|
| RA/Dec grid, Catalogue objects, Gaia stars | tick boxes | all on |
| Faintest star (G) | 4 to 11 | 10 |
| Draw the solution | draws the layers, measures the residuals and fits the colour | needs a plate solution |
| Annotated, Residuals, Residual map, Colour fit, Zero point, Limiting mag | the picture the viewer shows; a picture that could not be made has no chip | Annotated |
| Result | adds the residual-map scale and rotation, and the green zero point with its error and the 5-sigma limit | |
| Report, Save report | folder for the picture, lists, residuals, colour fit and report.html | astrometry-report beside the image |
Light curve (Science panel of the Stack step, below the integration controls): give the folder
of frames, tick The brightest unsaturated star or untick it and give x and y in the
reference frame, set the aperture and press Measure the star. The Light curve chip appears
beside the others, and the panel says the scatter of the star and of the check star.
| Control | Range | Default |
|---|---|---|
| The brightest unsaturated star | tick box | on |
| x, y (reference frame) | pixels | the star found, after a run |
| Aperture (FWHM) | 1 to 5 | 2.0 |
| Measure the star | registers, measures, draws |
Checked against astropy, photutils and numpy
scripts/compare_python_astrometry.py repeats the measurements with different code
(astropy 8.0.2, photutils 3.1.1):
| Output | Check | Result |
|---|---|---|
| residuals, IC 5070 stack, 40 stars | the predicted pixel position of each Gaia star against astropy.wcs.WCS.all_world2pix of the solved header |
the same to 0.0013 px at most; residual rms 0.0978 px (Valerian) against 0.0979 px (astropy) |
| colour fit, 36 Gaia stars | the instrumental colours from photutils aperture photometry (CircularAperture, sigma-clipped CircularAnnulus, same positions and radius) against the table's |
red/green: median difference +0.0002 mag, rms 0.0005, largest 0.0027; blue/green: median -0.0001, rms 0.0016, largest 0.0072 |
| colour fit, lines on the 33 stars used | numpy polyfit on the photutils colours against on the table's |
red: slope -0.635 and zero -0.305 against -0.635 and -0.306; blue: +0.082 and -0.015 against +0.080 and -0.015 |
| photometry, 5 H-alpha frames (ASI1600MM) | the flux of the star at each frame's position and aperture from photutils (exact pixel overlap, sigma-clipped annulus median) against the table's | ratio 1.0009 median, 0.9966 to 1.0021: within 0.4 per cent |
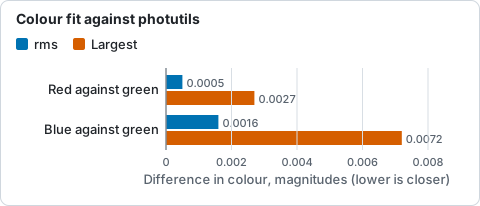
Difference between Valerian's instrumental colours and photutils' for 36 Gaia stars, rms and largest, from the table above: all below 0.01 mag.
The photutils fluxes use exact pixel overlap and Valerian's colour fit weights the aperture edge by a linear ramp, hence the few thousandths of a magnitude; the photometry module uses exact fractions (6 by 6 subpixels at the edge) and agrees to 0.1 per cent in the median.
Limits of the method
- The residuals can only show what the catalogue stars show: with fewer than about 30 matched stars a pattern is hard to see, and Gaia positions are at epoch 2016.0 with no proper motion applied, which matters for the few bright nearby stars only.
- The object ellipses use catalogued sizes and angles that are often rough; they say where to look, not where a galaxy ends.
- The light curve's error is the sky noise alone. Compare it with the check star's scatter to know the real precision.
- The comparison stars are assumed constant. A variable comparison star shows in the check star;
give
--comparisona smaller number, or choose the target away from a crowded field. - The zero point is only as good as the Gaia stars behind it: the colour fit keeps stars of G 6 to 11
(settable with
--min-mag,--max-mag) and a Seestar saturates the brightest of them, which shows as a drift in the first panel of the zero-point sheet. The catalogue's G band is not the camera's band: the magnitudes are Gaia-G equivalents through the colour equation, valid for ordinary stars between BP-RP 0.3 and 2.5, not for emission-line objects or very red stars. - The limiting magnitude is extrapolated from the apertures: nothing in the bundled catalogue is fainter than G 11. It is for a faint point source on the sky level of the field; a star on a bright nebula is shallower. A stacked image has correlated noise (resampling, drizzle), so its aperture noise is lower than a pixel-by-pixel estimate would say; the measured aperture noise already includes that.
- The residual map is as good as the Gaia positions at epoch 2016.0; stars with large proper motion (a few per square degree) shift by their motion since then. They are few and the cell means are robust to them, the single-star vectors are not.
- A saturated star cannot be measured (its flux is clipped); the brightest unsaturated star is chosen automatically but a star saturated only in some frames is not caught.